 ℤ one has a “sampled” STFT. For analog (continuous-time) signal
s(t), the following equation defines the matrix of Fourier coefficients in the
STFT:
ℤ one has a “sampled” STFT. For analog (continuous-time) signal
s(t), the following equation defines the matrix of Fourier coefficients in the
STFT:
Linguists are generally aware of the spectrogram as a type of image showing the time-frequency structure of a speech signal. Speech processing engineers are usually more well-versed in the subject, but even among seasoned practitioners the close affinity between the mathematics of the spectrogram and mathematical representations arising in quantum mechanics can be an intriguing surprise. The original spectrograms were produced by the spectrograph, which was an electrical signal processing machine developed at Bell Labs in the years leading up to World War II. Its developers knew that the spectrogram images showed a kind of time-localized Fourier decomposition of a sound signal into constituent frequencies, but hey, they were engineers and inventors, not mathematicians. The results of their work were first published in a series of papers in 1945-46.
A spectrogram was first defined mathematically (in one particular sense) by Gabor (1946) [J. IEE Part III, 93(26)]—an amazing coincidence, since Gabor was unaware there was a real device that produced them until after he had submitted his paper. Gabor was also the first to recognize the close similarity between quantum mechanical concepts and time-frequency analysis, and in fact his appreciation of quantum mechanics seems to have led him to his successful theory of time-frequency analysis. In his seminal paper, for example, he also showed that the time-frequency uncertainty principle was the same as the Heisenberg uncertainty which relates position and momentum in a quantum state. In a general form it can be stated as: A nonzero function and its Fourier transform cannot both be sharply localized. In quantum mechanics, this means that, among other things, the position and momentum in a quantum state cannot both be precisely determined. In a spectrogram or any time-frequency analysis, this means that the time and frequency of something in the signal cannot both be precisely determined.
Let’s take a look at a bit of the mathematics, as it is presented by Daubechies et
al. (1990) [IEEE Trans. Inf. Theory 36(5)]. A spectrogram is essentially a 2-D plot of
the log-magnitude of a short-time Fourier transform (STFT). An STFT is performed
by first multiplying a signal function s(t) by a compactly supported “window”
function g, and sliding the window along the signal to positions g(t-nt0) and taking
this signal-window product again, building up a sequence of windowed signal frames.
For n ℤ one has a “sampled” STFT. For analog (continuous-time) signal
s(t), the following equation defines the matrix of Fourier coefficients in the
STFT:
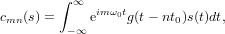 | (1) |
for integers m,n.
The STFT is very similar to Gabor’s time-frequency representation, although it is more general. Gabor specifically suggested representing the localized time-frequency content of a signal in a time-frequency ”phase space” (mathematically equivalent to position-momentum and other classical phase spaces) using a lattice of elementary functions; these are a kind of reciprocal of the STFT windows g, in a way whose details were worked out more recently. His choice of elementary function was the Gaussian, since that would provide a lattice of coherent states in the quantum mechanical setting. Schrödinger (1926) had already derived a coherent state in quantum mechanics as a minimum uncertainty Gaussian wave packet. The point of a coherent quantum state is that it provides expectation values of the equations of motion which equal the classical equations of motion, so it is useful for pseudoclassical calculations within quantum mechanics. A common example is provided by a laser, which is basically light in a coherent state.
Moreover, the Fourier coefficients cmn(s) in the equation can also be understood as inner products (in a function space) of the signal s with a discrete lattice of coherent states. Gabor’s lattice is precisely a lattice of coherent states, also known as a Weyl-Heisenberg lattice or von Neumann lattice in quantum mechanics. Going even deeper, the lattice of states for a Gabor spectrogram is a specific example of a set of “coherent states associated with a Lie group,” in particular the Heisenberg group. Much of this material is also covered in Feichtinger and Strohmer’s introductory chapter to their book Gabor Analysis and Algorithms (1998).