Theoretical Titration Curves:
Precipitation Titrations
©David L. Zellmer, Ph.D.
Department of Chemistry
California State University, Fresno
March 3, 1997
|
Traditional methods of calculating titration curves involve specifying the
milliliters of titrant added, computing the composition of the solution at that
point, then solving the resulting equilibrium problems for the concentration of
the ion being plotted, usually as -log C, or pC. The method below turns this
method backwards, specifying pC first, then computing the mL of titrant needed
to reach this point. The titration of sodium chloride with silver nitrate is
used as an example.
Assume silver nitrate is used to titrate a solution of sodium chloride. The
total ionic equation is:
Ag+ + NO3- + Na+ +
Cl- = AgCl(s) + Na+ + Cl-
If we then define:
mmCl
|
millimoles
of NaCl used
|
MAg
|
Molarity
of the silver nitrate titrant
|
Vo
|
beginning
volume in the titration vessel in milliliters
|
Vml
|
milliliters
of titrant dispensed
|
Ksp
|
solubility
product for silver chloride
|
Then we can write the following mathematical expressions for the titration:
Equilibrium
|
Ksp
= [Ag+][Cl-]
|
Charge
Balance
|
[Ag+]
+ [Na+] = [Cl-] + [NO3-]
|
Combining equations, and using the definitions above we get (* means multiply,
as used by computers):
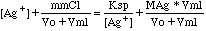
Rather than solving the above expression for [Ag+] as a
function of Vml, it is simpler for a computer model if we solve for Vml
instead. The result is:
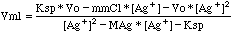
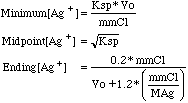
The range of possible values for [Ag+] starts with the first
appearance of AgCl precipitate and ends at 20% past the end point.
Because we will be doing a potentiometric titration; with a silver
electrode and a suitable reference electrode, our readout in lab as we do the
titration will be in millivolts from a pH meter. We can model this behavior
using the Nernst equation:
E (in mv) = K (in mv) + S (slope in mv)*log10([Ag+]),
or
E (in mv) = K - S*pAg, where pAg = -log10([Ag+])
S is theoretically +59.2 mv for the Ag+/Ag couple. K depends on the
reference electrode used. Log10 is the logarithm to base 10.
Setting up these equations in Microsoft Excel 5.0, we get
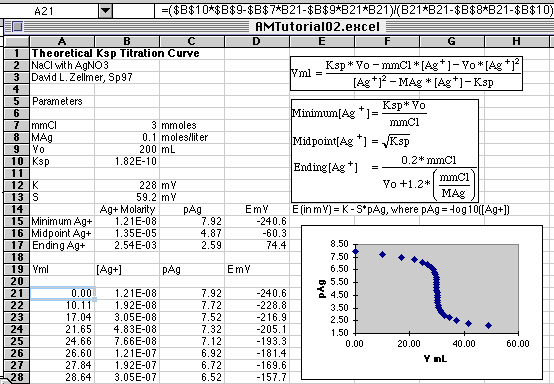
This formidable-looking spreadsheet simply evaluates the functions we have
defined. We begin with the Parameters section where values are assigned
to the constants listed. So we know what range of pAg to use in computing our
titration curve, rows 15, 16, and 17 calculate our beginning, end point, and
20% excess pAg values. If we are simulating what we might see on our millivolt
readouts, E mV is also computed from E=K-S*pAg. S has been set to the
traditional 59.2 mV value from the Nernst Equation at 25o C. The
value of K set to 228 is the assumed potential of a silver/silver chloride
reference electrode. Because of liquid junction potentials and other
real-world effects, the observed potentials probably won't be equal to these
values.
Starting in cell C21 we put in our starting value of pAg, then fill down with
values increasing in 0.20 pAg unit increments. You can make this increment
smaller if you want more points on your simulated graph. The Series...
commands in Excel were used in this case to create column C21:C50. A few
additional values were added at the end to give a longer tail to the curve so
that the graph would be suitable for a Gran's Plot analysis. (See the Gran's
Plot tutorial. The data will look familiar!)
With the pAg values in place, we now add the formulas for [Ag+] in column B,
and Vml in column A. Finally, we compute E mV in column D. The columns were
put in this order to make plotting easier later on.
Cell B21=10^-C21
Cell A21=($B$10*$B$9-$B$7*B21-$B$9*B21*B21)/(B21*B21-$B$8*B21-$B$10)
Cell D21=$B$12-$B$13*C21
The theoretical plot of E mV vs. VmL is then
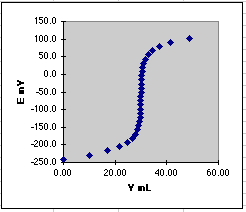
It is useful to compare this theoretical plot with a real one done in
the lab. Serious distortions can point to experimental problems. For example,
a student once used a single junction Ag/AgCl reference electrode instead of
the correct double junction electrode, leaking chloride into the solution and
changing the shape of the curve. Simulated data can also be used to test
computerized end point detection methods. To add reality to the data, use a
random number generator to add a little noise to the computed millivolt values.
It is instructive to see how sensitive an end point method is to noise.
For questions or comments contact:
David L. Zellmer, Ph.D.
Department of Chemistry
California State University, Fresno
E-mail: david_zellmer@csufresno.edu
This page was last updated on 3 March 1997