A Basic Working Curve Plot
with Regression Line
and LLS Calculation of Errors using STEYX()

©David L. Zellmer, Ph.D.
Department of Chemistry
California State University, Fresno


Starting with the basic techniques of graphing and use of the LINEST() function then plotting multiple series and estimating errors, we now will use more Excel statistical functions such as STEYX() to calculate the errors of our Linear Least Squares fit.
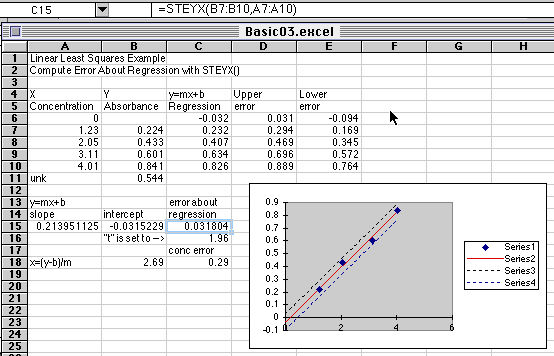
  1. In cell C15 we find the Excel function STEYX(y-values,x-values), which computes the standard error about regression. This is basically the standard deviation of the differences about the regression line. The X and Y arrays are the same as those used in the LINEST() function in the previous tutorial. Note that the value of STEYX is about 0.03 absorbance units, which is what we estimated for our error in the second tutorial.

  2. We can use this value of STEYX to draw error limits on our plot. Before doing this, however, we must review what we learned about Confidence Limits. One standard deviation includes about 68% of our data, while 1.96 standard deviations contain 95% of our data. (We will save the effect N on the error and of degrees of freedom on Student's t for the next tutorial.) So for a quick and dirty estimate of 95% confidence limits, we will multiply STEYX by 1.96 as shown in cell C16.

  3. The error in concentration is easily computed from the error in absorbance by taking the derivative of y=mx+b. dy=mdx, so the error in x (concentration) is just the error in y (absorbance), divided by m (the slope). The result of dividing by the slope to get the concentration error is found in cell C18 and is =C16*C15/A15. Note that we have included our 1.96 multiplier for this error, making it about twice as big as the one we estimated in a previous tutorial.

  4. The job of actually producing a plot with all the error limits showing would be quite complicated to show in a step-by-step fashion, so I will give you some hints and let you play with the graph yourself.

  5. In the next tutorial you will learn how to use the official error equation for linear least squares analysis. The only problem is that the official formula may grossly overestimate the error when the regression line contains only three or four points, as ours typically may. The estimates shown here are probably more realistic.

Return to LLS Basic Master Page
For questions or comments, contact Dr. David Zellmer at david_zellmer@csufresno.edu.

Last Updated: 8 February 1997