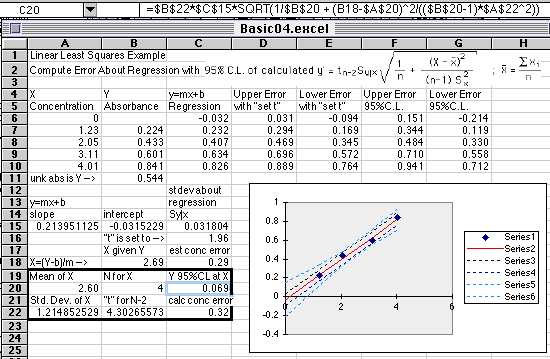
A Basic Working Curve Plot
with Regression Line
and LLS Calculation of Errors using:

©David L. Zellmer, Ph.D.
Department of Chemistry
California State University, Fresno


Starting with the basic techniques of graphing and use of the LINEST() function then plotting multiple series and estimating errors, we now will use several Excel statistical functions to calculate the errors of our Linear Least Squares fit using the complete error formula given above.
  1. Our simple spreadsheet has gotten quite messy by now, as initial estimates clutter our screen for comparison purposes. Here we show how to use the "true" error equation for computing the uncertainty about the regression line.

    To compute this we need to use the following Excel statistical functions:

  2. In Cell B11 we find an experimentally measured absorbance for an unknown. This "Y" value is converted to a concentration "X" value in Cell B18 with the formula =(B11-$B$15)/$A$15 using our computed values for slope and intercept. X is a required value in our 95%CL calculation.

  3. In cell C20 we find a single calculation of the 95%CL about regression. The formula is
    =$B$22*$C$15*SQRT(1/$B$20 + (B18-$A$20)^2/(($B$20-1)*$A$22^2))
    Check these cell references against the algebraic formula to see how it was set up.

  4. In cell C22 we find =C20/A15. Remember that given the error in "Y", we get the error in "X" by dividing the Y error in C20 by the slope of the line in A15. The number computed is the error in the concentration found by using the absorbance of the unknown to compute concentration from the linear working curve.

  5. Cell F6=C6+$B$22*$C$15*SQRT(1/$B$20 + (A6-$A$20)^2/(($B$20-1)*$A$22^2)). It is the first in a series that computes the upper 95% confidence limit for the entire regression curve. We have included an X=0 point here to bring our graph down near the origin at (0,0). As this formula is filled down, we create all the upper limit values for our plot. These are graphed as the outer curved line on the chart shown. The lower curved line is created in a similar fashion in the G column.

  6. For comparison we have included the "fixed error estimates" from Tutorial LLSBasic03 in columns D and E. These form the inner straight lines on the plot. This error estimate is simply the "2-sigma" t value of 1.96 multiplied by the standard deviation about regression Sy|x. Two standard deviations around any experimental value generally include about 95% of the data observed and can serve as a "quick and dirty" estimate of error.

  7. Compare Cell C18 to Cell C22. C18 is the error estimated from a fixed t-value of 1.96. C22 is the error computed from the full 95%CL calculation. At an absorbance of 0.544 near the center of the plot, the two values are almost the same. But if you look at values near the extremes of the plot you find that the 95%CL calculations give much larger errors than the fixed t estimates. Experience has shown that these calculated 95%CL errors are probably larger than they should be, especially when the data points plotted are few, but even so it points out the dangers of extrapolating past the ends of our experimental data.

  8. If you think this presentation was confusing, wait until you see the treatment given to LLS errors in most Analytical Chemistry textbooks. Careful analysis will show that we are all saying the same thing, however.

Return to LLS Basic Master Page
For questions or comments, contact Dr. David Zellmer at david_zellmer@csufresno.edu.

Last Updated: 9 February 1997