Using Insert/Trendline for Curve Fitting
in Excel 5.0
- Plot your data as usual in Excel 5.0, probably using the Chart Wizard.
- Double click on the graph to place it into Edit mode.
- Click on one of the the graph data markers to select the data series.
- Select Trendline... from the Insert menu.
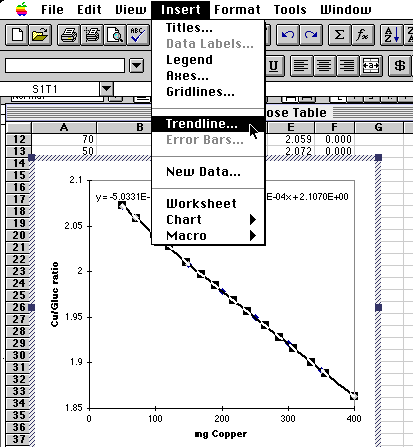
- From the dialog box that comes up, select the type of fit you want.

- The equation will be printed as text onto your chart.
- To see more significant figures for the coefficients, make sure the chart is still selected, then click on the formula just generated on your chart to select it. Choose Format/Selected Data Labels... from the menubar and use the resulting dialog box to choose the numerical format you wish.
For questions or comments, contact Dr. David L. Zellmer at david_zellmer@csufresno.edu.
Last updated: 04 December 1996